Find the right interactive map without trawling the web.
Search directly, start from a lane, or browse the most useful maps first. Weather, satellites, history, flights, genomics, and crisis monitoring stay organized separately so discovery is fast.
Atlas lanes
Choose the topic lane you want to explore
Start here
Popular maps first
 Weather, hazards & alertsWeatherventusky.com
Weather
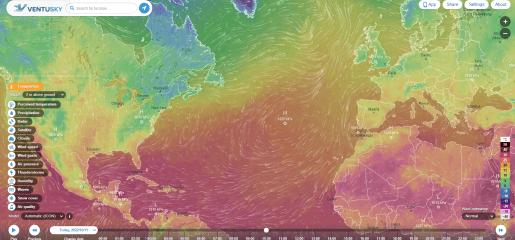
This interactive map shows the current weather conditions around the world. It covers the following metrics: Temperature, perceived temperature, precipitation, radar, clouds, wind speed, wind gusts, air pressure, thunderstorms, humidity, waves, snow cover and air quality. It offers the option to customise most of them by altitude or other parameters.
WeatherRadar & windQuakes & volcanoes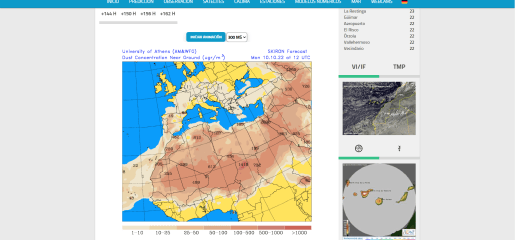 Life sciences & healthHealthwindy.com
Dust Mass
This map shows dust mass concentrations around the world. It provides real-time data on dust distribution and density.
HealthGenomics & cellsAnatomy & molecules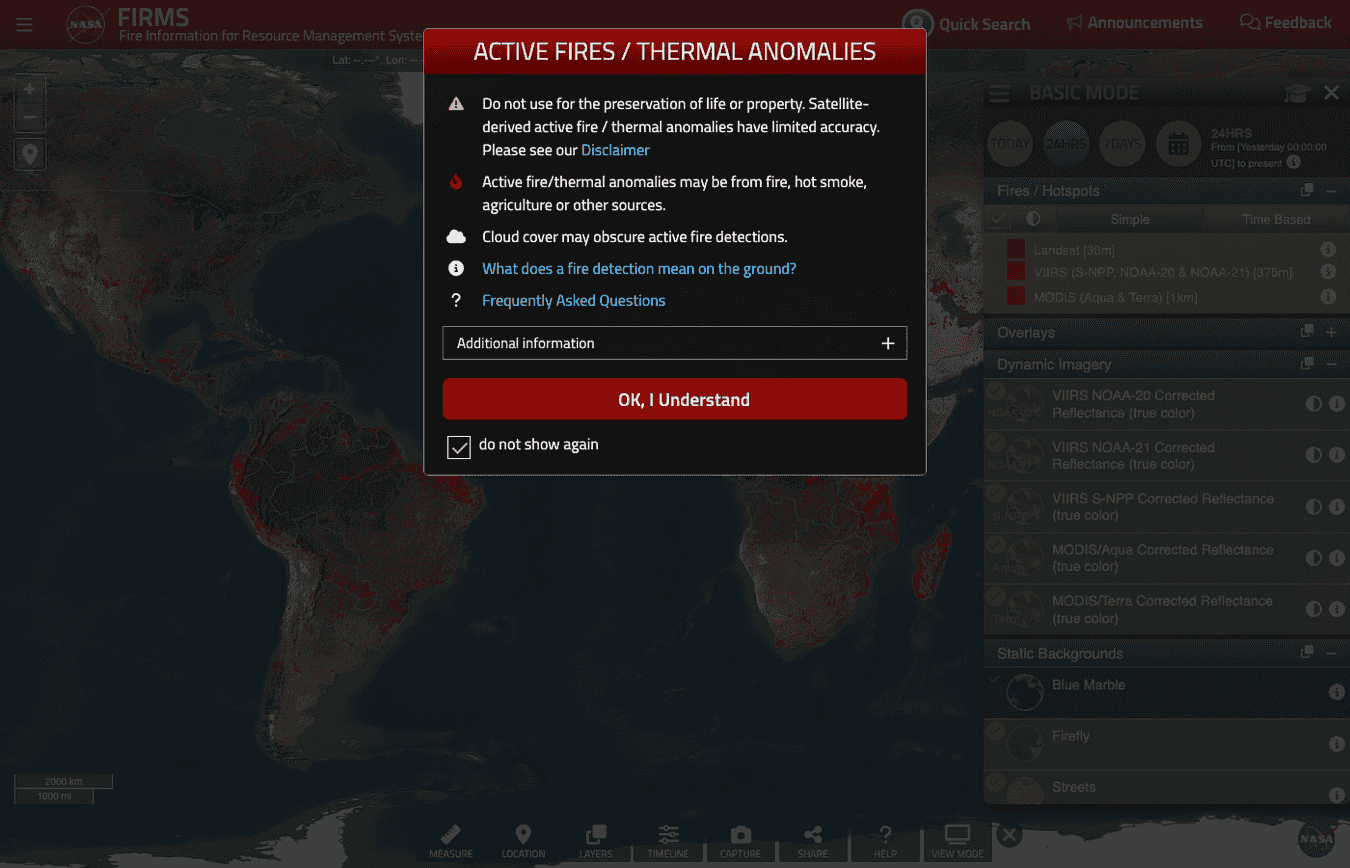 Weather, hazards & alertsHazards & Earth Systemsfirms.modaps.eosdis.nasa.gov
NASA FIRMS Fire Map
Near real-time active fire detections and thermal anomalies from MODIS/VIIRS.
Hazards & Earth SystemsRadar & windQuakes & volcanoes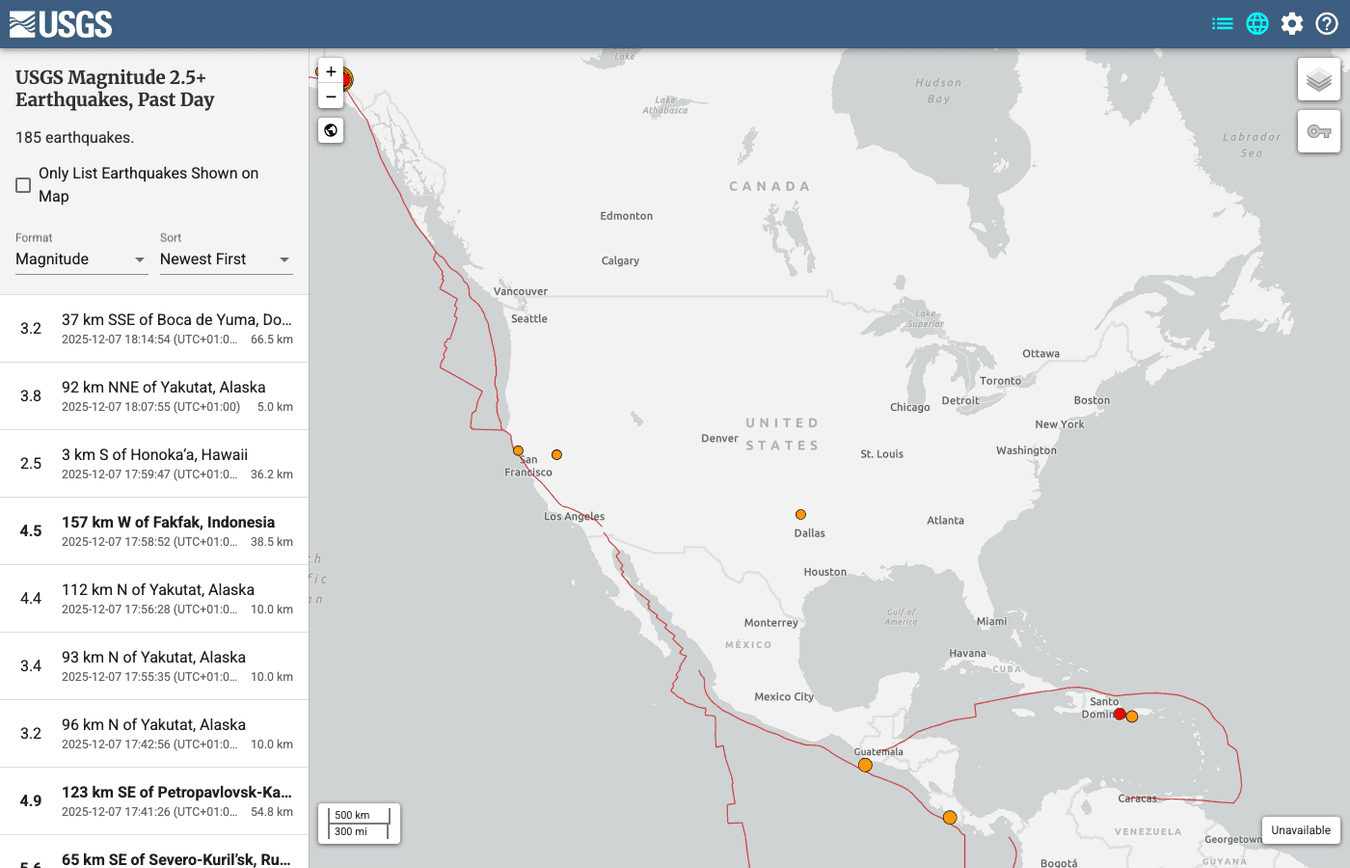 Weather, hazards & alertsHazards & Earth Systemsearthquake.usgs.gov
USGS Latest Earthquakes
Interactive list and map of recent earthquakes worldwide with filters and feeds.
Hazards & Earth SystemsRadar & windQuakes & volcanoes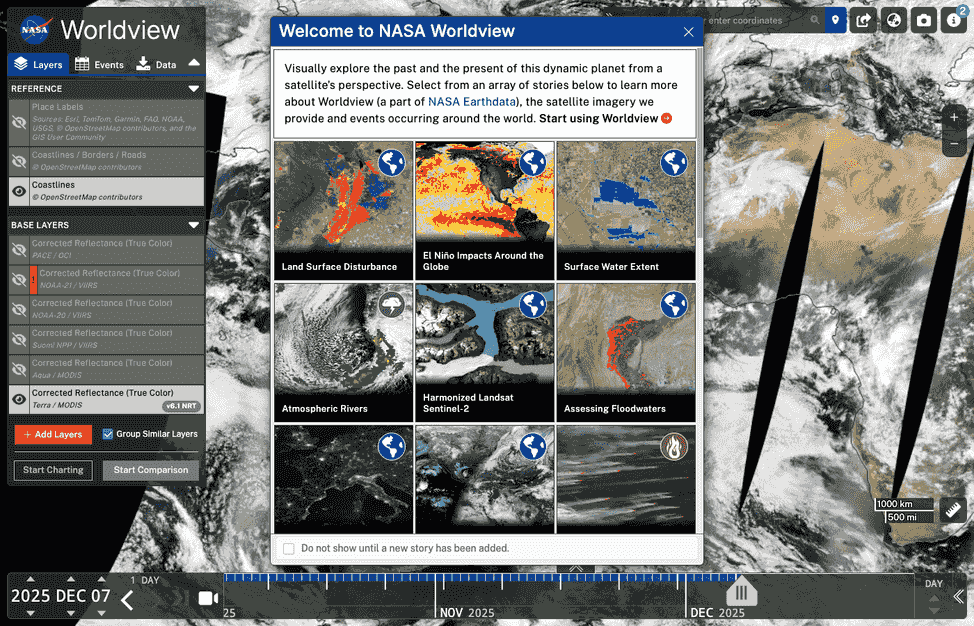 Earth imaging & terrainEarth Observationworldview.earthdata.nasa.gov
NASA Worldview
Near-real-time Earth imagery with 1,200+ layers and animation/comparison tools.
Earth Observation3D globesTimelapses & shade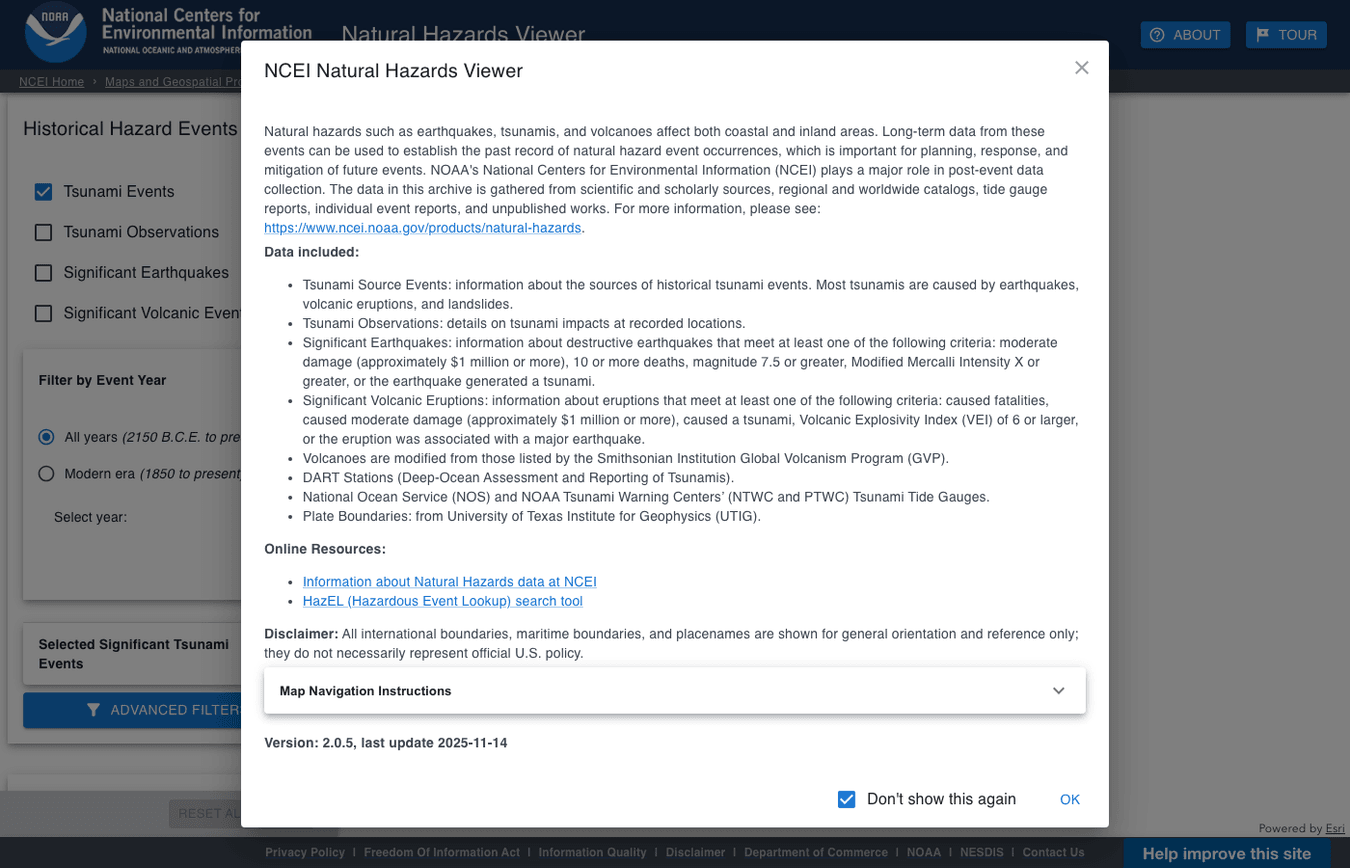 Weather, hazards & alertsHazards & Earth Systemsncei.noaa.gov
NOAA NCEI Natural Hazards Viewer
Significant tsunami, earthquake, and volcano events mapped with data overlays.
Hazards & Earth SystemsRadar & windQuakes & volcanoes


Map finder
Browse all maps
- Weather, hazards & alertsWeatherventusky.com
Weather
This interactive map shows the current weather conditions around the world. It covers the following metrics: Temperature, perceived temperature, precipitation, radar, clouds, wind speed, wind gusts, air pressure, thunderstorms, humidity, waves, snow cover and air quality. It offers the option to customise most of them by altitude or other parameters.
WeatherRadar & windQuakes & volcanoes - Life sciences & healthHealthwindy.com
Dust Mass
This map shows dust mass concentrations around the world. It provides real-time data on dust distribution and density.
HealthGenomics & cellsAnatomy & molecules - Weather, hazards & alertsHazards & Earth Systemsfirms.modaps.eosdis.nasa.gov
NASA FIRMS Fire Map
Near real-time active fire detections and thermal anomalies from MODIS/VIIRS.
Hazards & Earth SystemsRadar & windQuakes & volcanoes - Weather, hazards & alertsHazards & Earth Systemsearthquake.usgs.gov
USGS Latest Earthquakes
Interactive list and map of recent earthquakes worldwide with filters and feeds.
Hazards & Earth SystemsRadar & windQuakes & volcanoes - Earth imaging & terrainEarth Observationworldview.earthdata.nasa.gov
NASA Worldview
Near-real-time Earth imagery with 1,200+ layers and animation/comparison tools.
Earth Observation3D globesTimelapses & shade - Weather, hazards & alertsHazards & Earth Systemsncei.noaa.gov
NOAA NCEI Natural Hazards Viewer
Significant tsunami, earthquake, and volcano events mapped with data overlays.
Hazards & Earth SystemsRadar & windQuakes & volcanoes 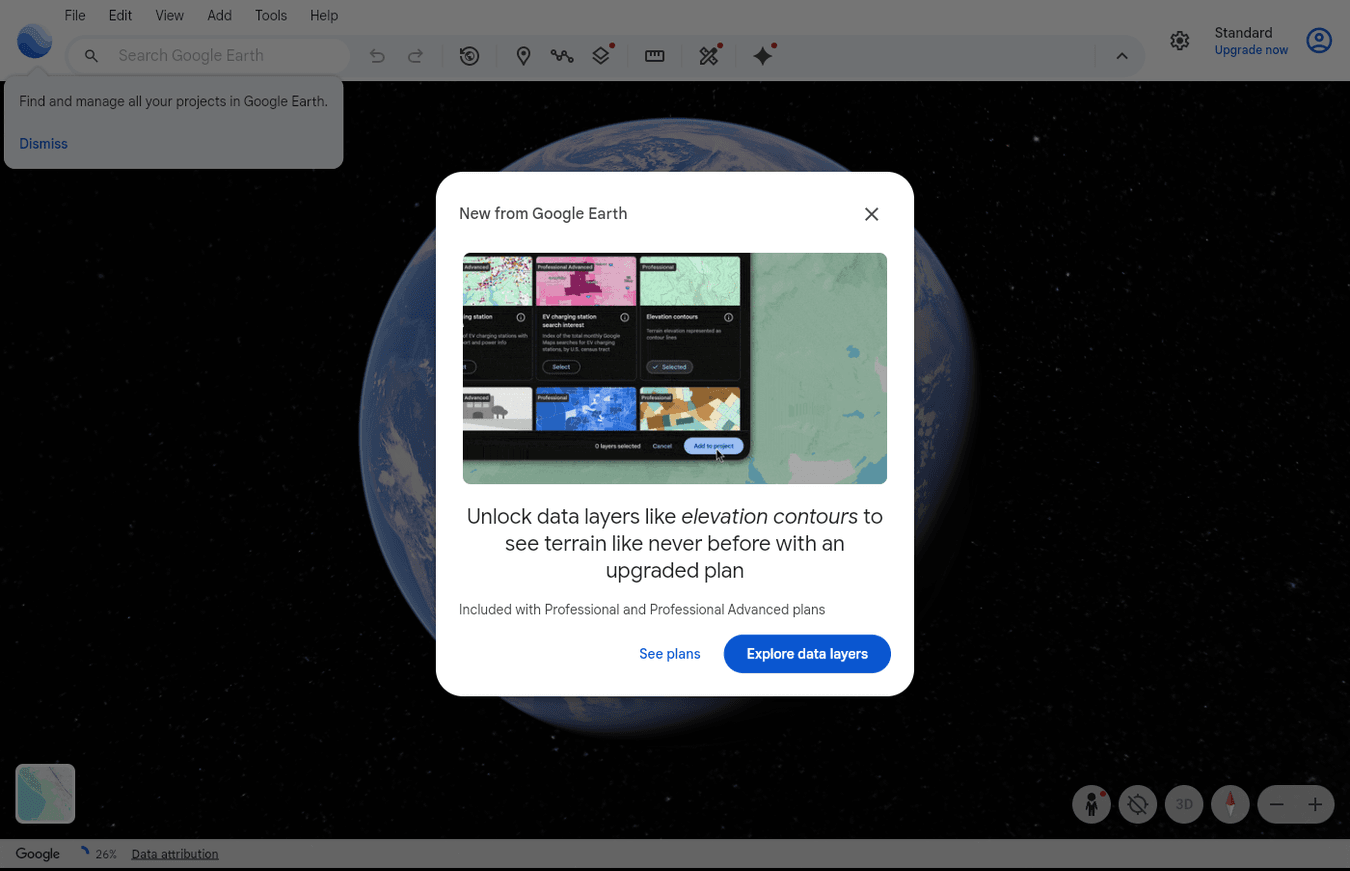 Earth imaging & terrainEarth Observationearth.google.com
Google Earth Timelapse
Historical and timelapse view of Earth to watch land-use change over decades.
Earth Observation3D globesTimelapses & shade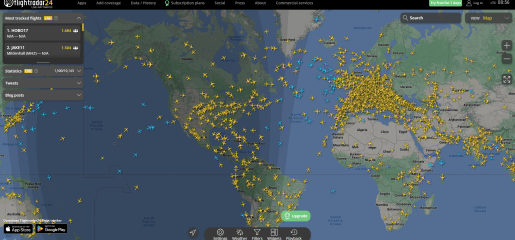 Mobility, travel & logisticsTransportflightradar24.com
Flights in real time
Map of flights in real time. You can search by flight number, airport or navigate the map to see the flights around the world. Different map styles and filters are available.
TransportFlights & shipsRoads & traffic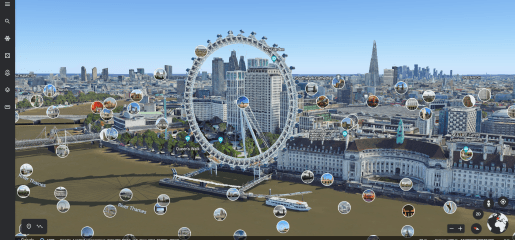 Earth imaging & terrainCuriosityearth.google.com
Google Earth explorer
This map allows you to explore the world using Google Earth. You can search for places, zoom in and out, and even use the 3D mode.
CuriosityEarth observation3D globes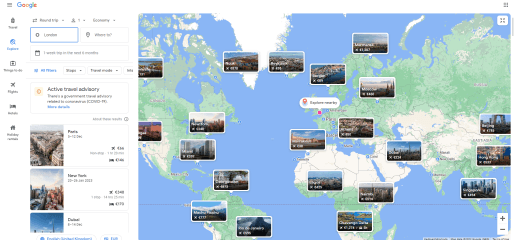 Mobility, travel & logisticsTransportgoogle.com
Flight prices explorer
Google Flights allows you to search for flights and compare prices. It allows you to search flights with very open parameters in a map view.
TransportFlights & shipsRoads & traffic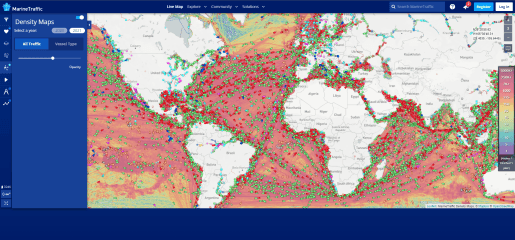 Mobility, travel & logisticsTransportmarinetraffic.com
Marine traffic
Map of marine traffic in real time. You can search by vessel name, MMSI, IMO, callsign or navigate the map to see the vessels around the world. Different map styles and filters are available.
TransportFlights & shipsRoads & traffic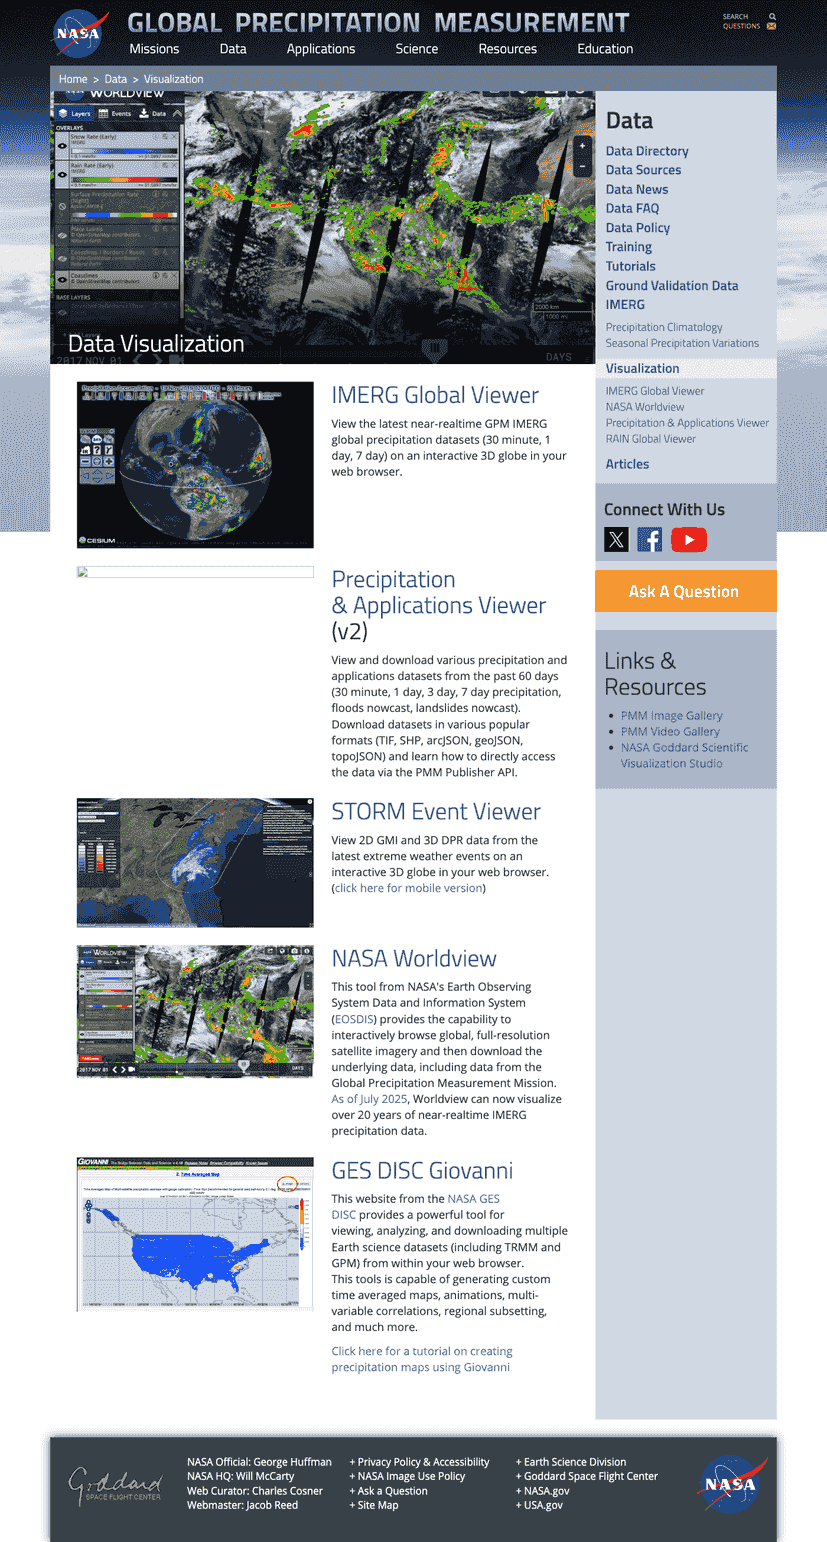 Weather, hazards & alertsHazards & Earth Systemsgpm.nasa.gov
NASA GPM IMERG Viewer
Global near-real-time precipitation layers on an interactive globe.
Hazards & Earth SystemsRadar & windQuakes & volcanoes


